Industry
Data Journalist
Client
Urban journalist network
My Role
Research / Web Development
Timeline
2024/4-2024-5
Digital Nomads: Global Lifestyle Rise and Local Impact
This project is part of a data visualization course in collaboration with UJN, focusing on uncovering narratives within existing data. By blending data with journalism, it explores the growing presence of digital nomads and their impact on local communities, presenting findings in a compelling, report-style format.

Overview
Challenge
Clarifying and Visualizing the Digital Nomad Impact
Solution
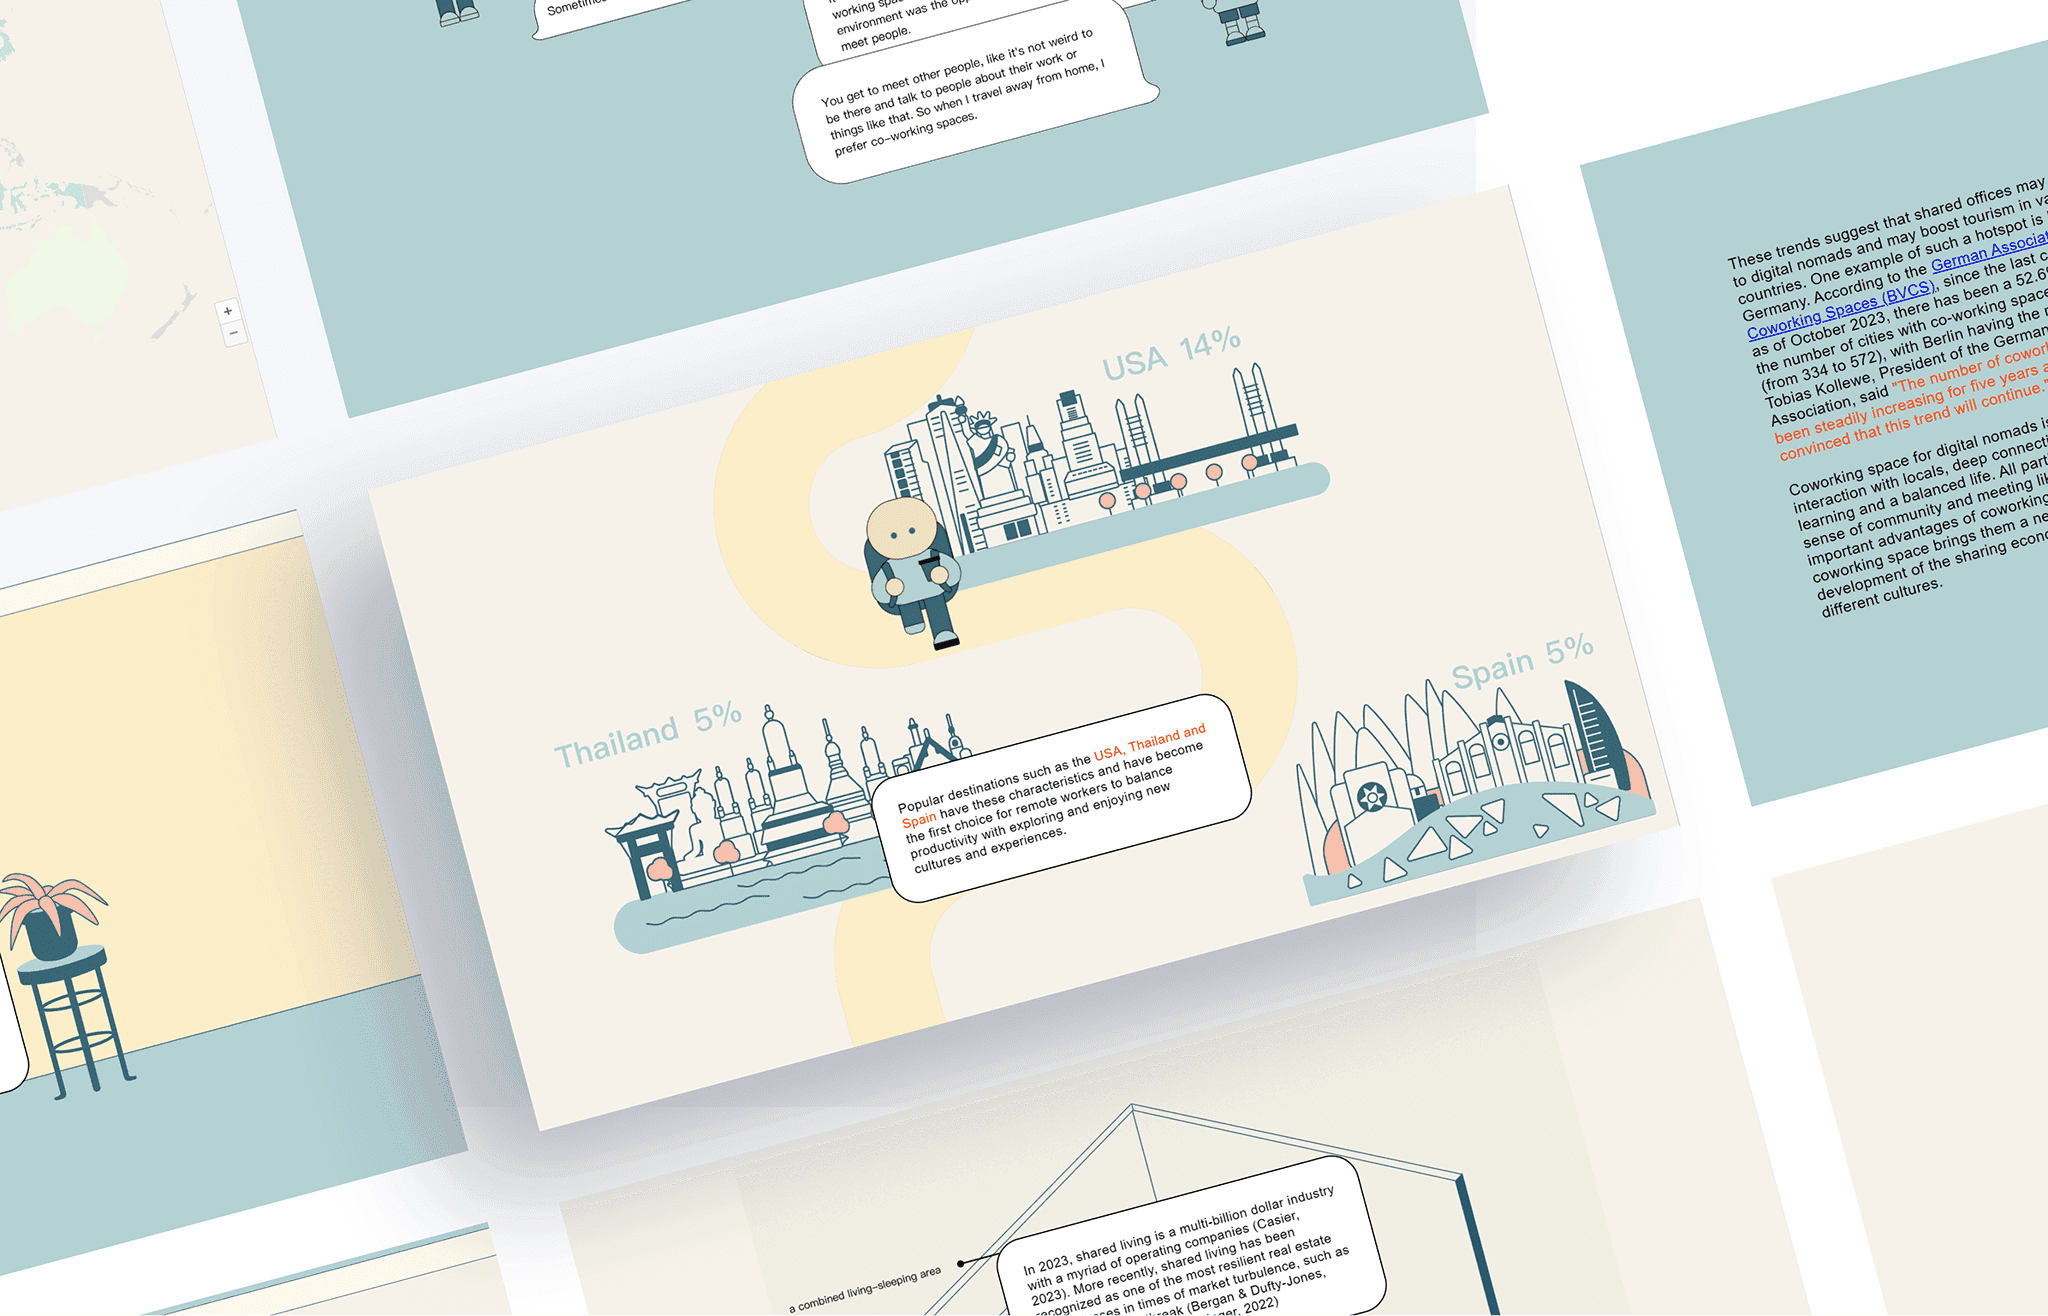
Scrolly Telling Journey with Illustrated Interface
Feature1
Scrolly-Telling Narrative
I structured the website as a journey, allowing users to explore the digital nomad story through seamless scrolling interactions.


Feature2
Illustrated Interface
I developed a unique visual style to enhance storytelling, making complex data more engaging and accessible.
Feature3
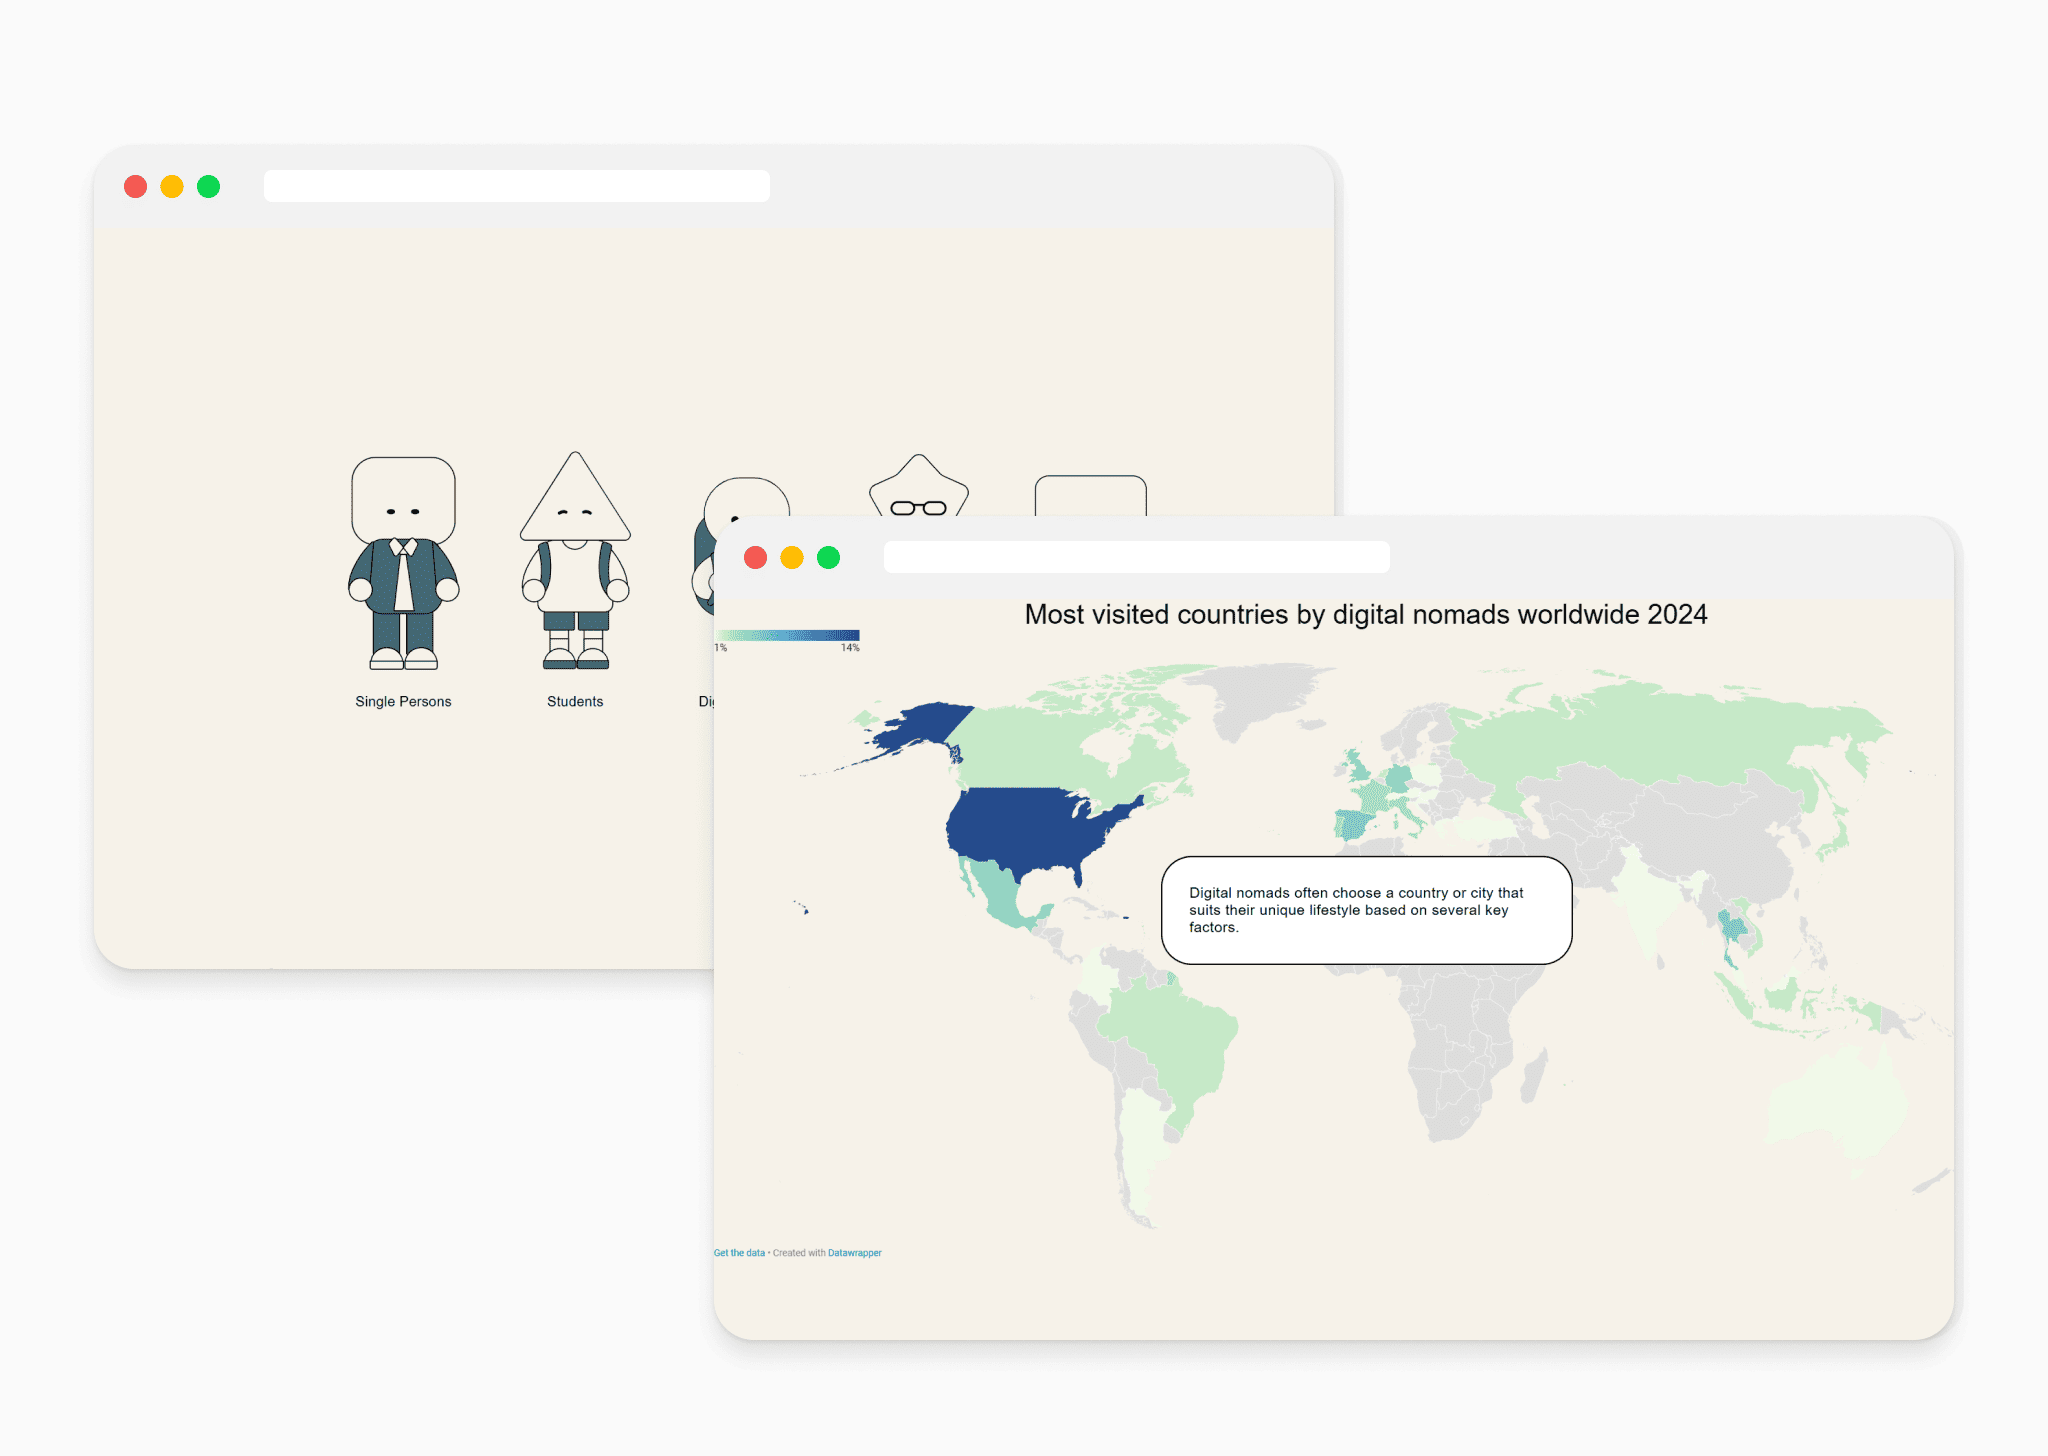
Seamless Data Integration
I utilized Datawrapper to create various data charts, ensuring that statistical insights are presented clearly and effectively to support the narrative.
Research
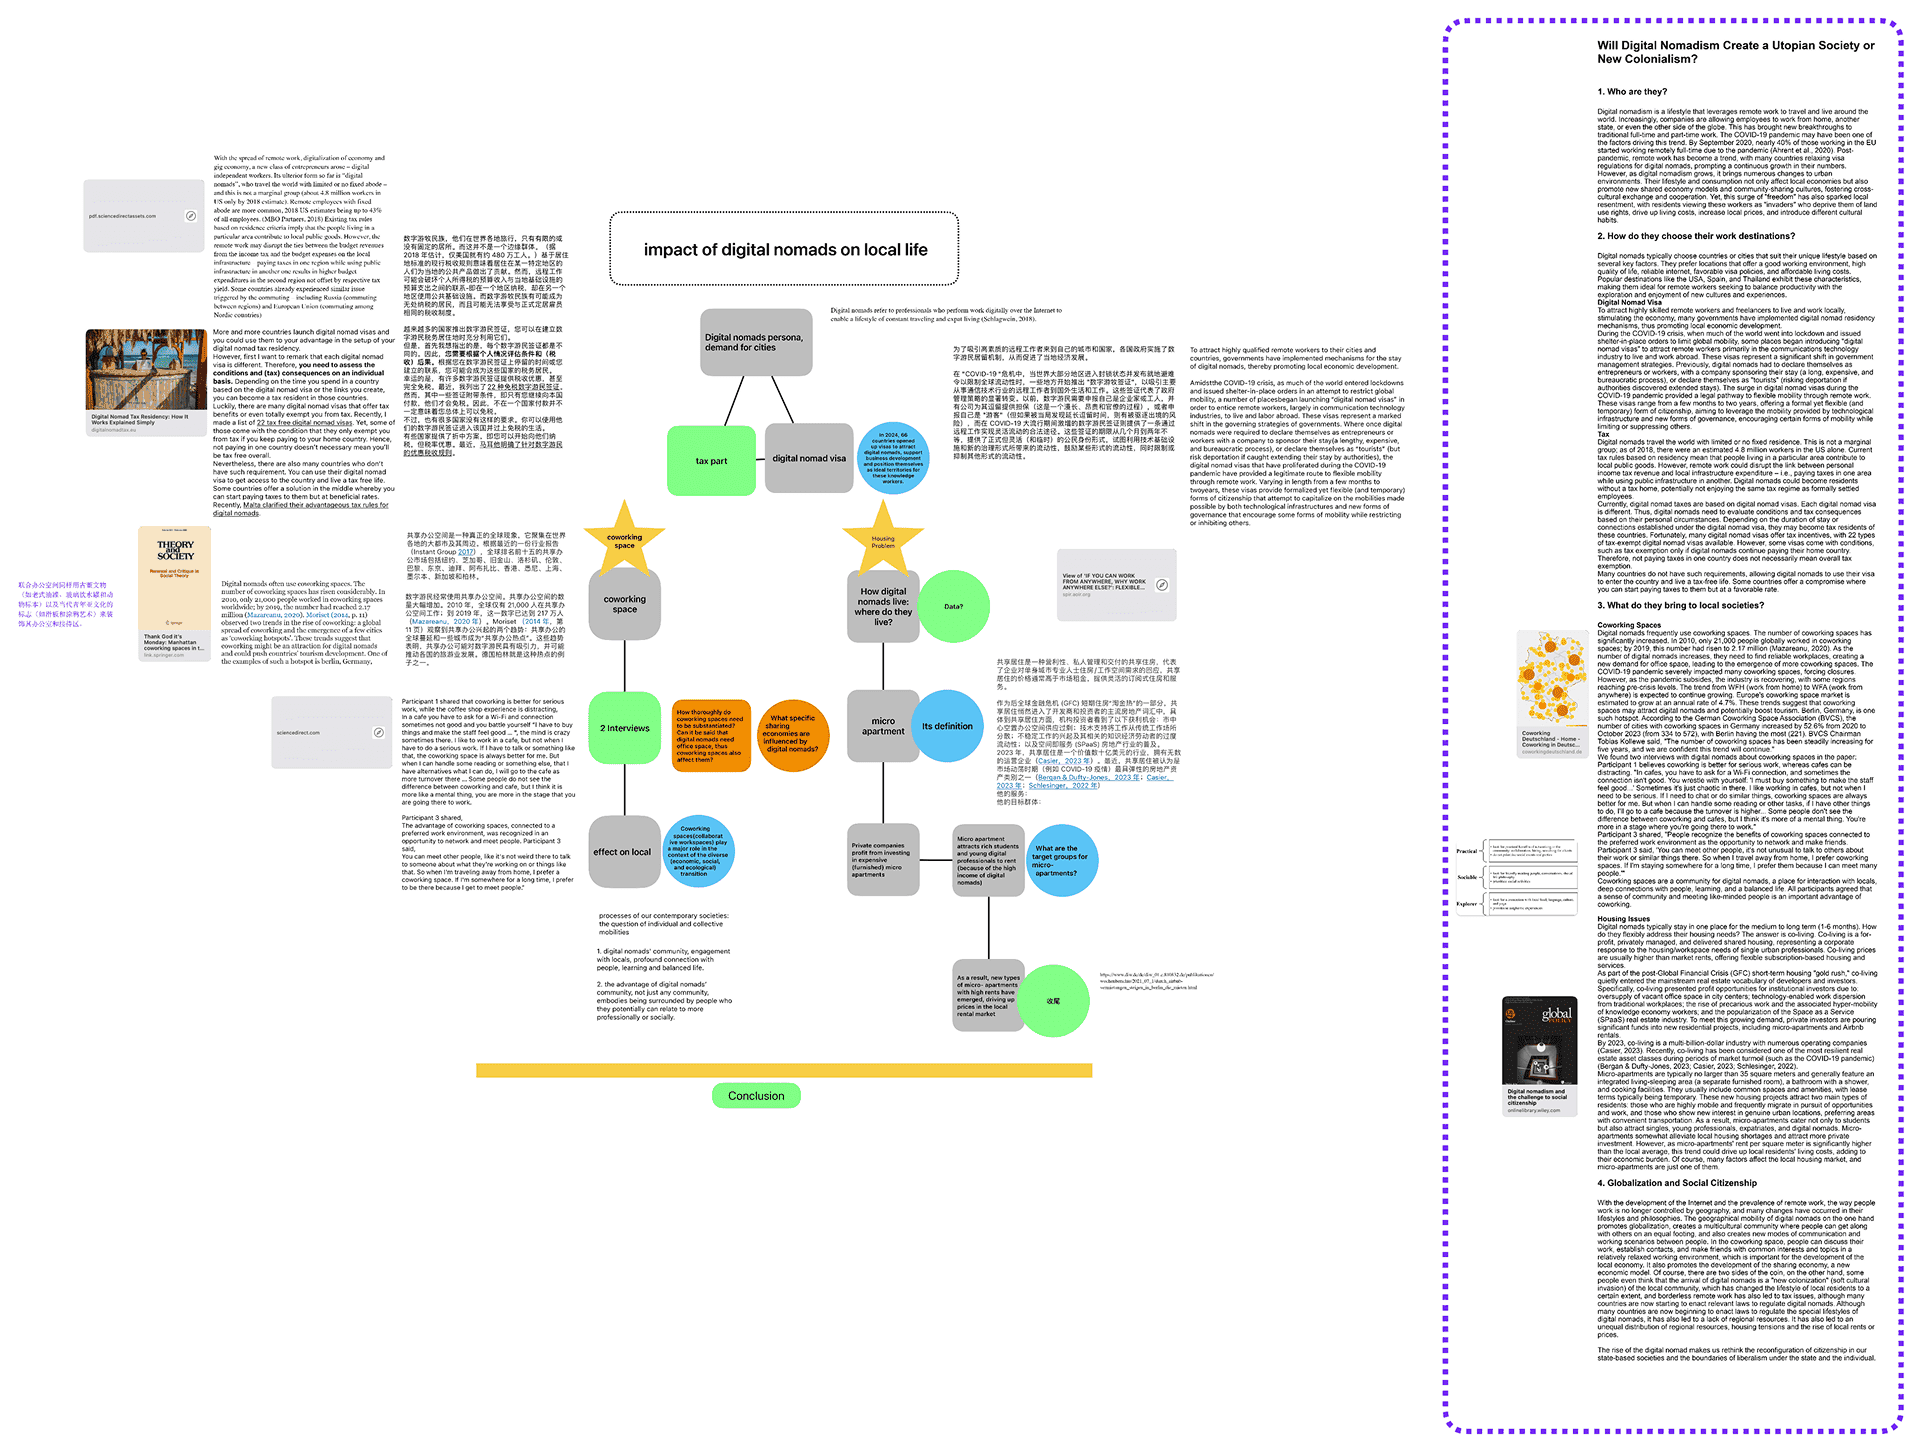
Story Discovery and Paper Review
We explored existing datasets to identify meaningful patterns and narratives related to digital nomads. To enhance the credibility of the findings, I conducted referencing academic papers, reports, and case studies that provide context and validation for the story.
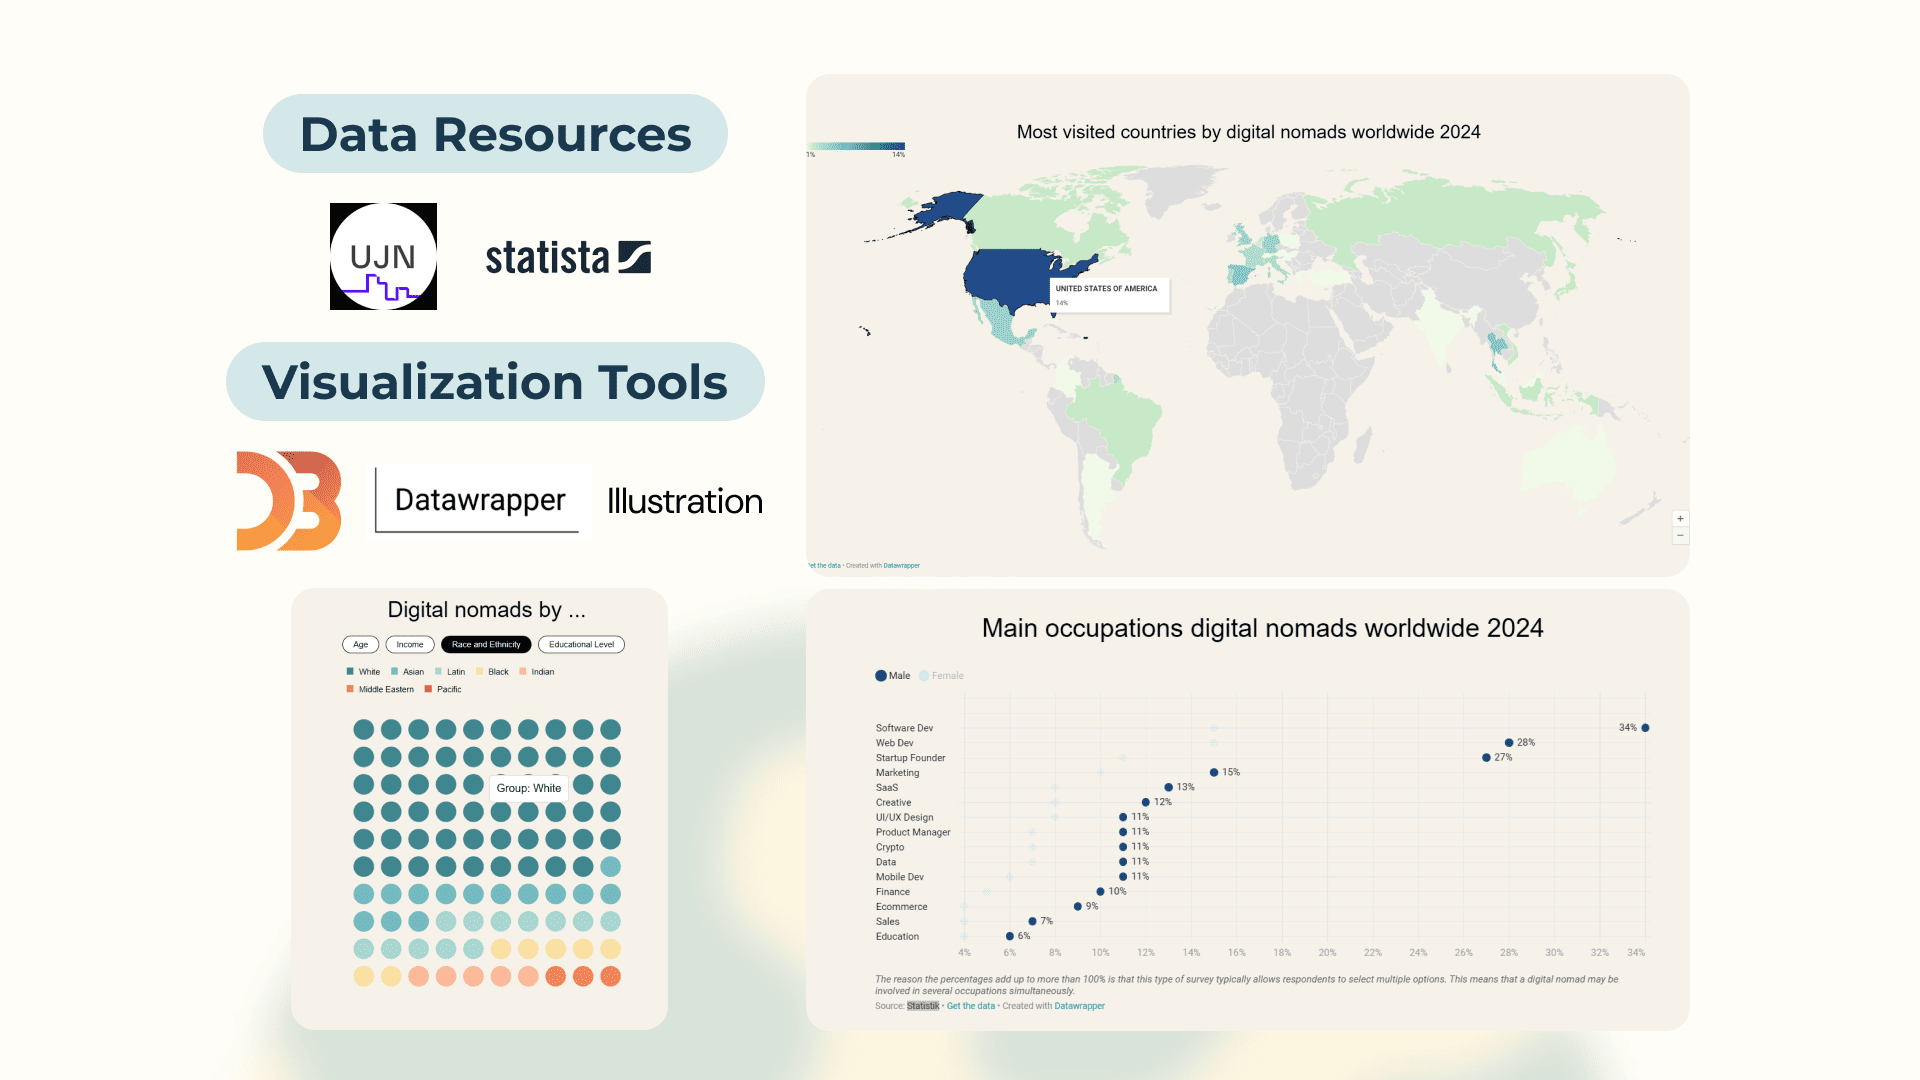
Data Collection, Analysis & Visualization
We gathered and organized relevant data from multiple sources, ensuring its accuracy and reliability. By structuring the data into verifiable evidence, I was able to create clear, data-backed insights. Additionally, I used visualization tools like Datawrapper, D3.js and illustrations to present complex information in an accessible and engaging format.

Sketch & Earlier Wireframe
To define the visual style, I focused on balancing playfulness with clear data visualization. The initial wireframe had an overly colorful palette, which proved distracting and diluted the connection between the news content and data. To refine this, I simplified the color scheme, ensuring that visuals supported rather than overwhelmed the storytelling. The final design maintains an engaging illustrated style while keeping the focus on the seamless integration of information and data-driven insights.